Model detail
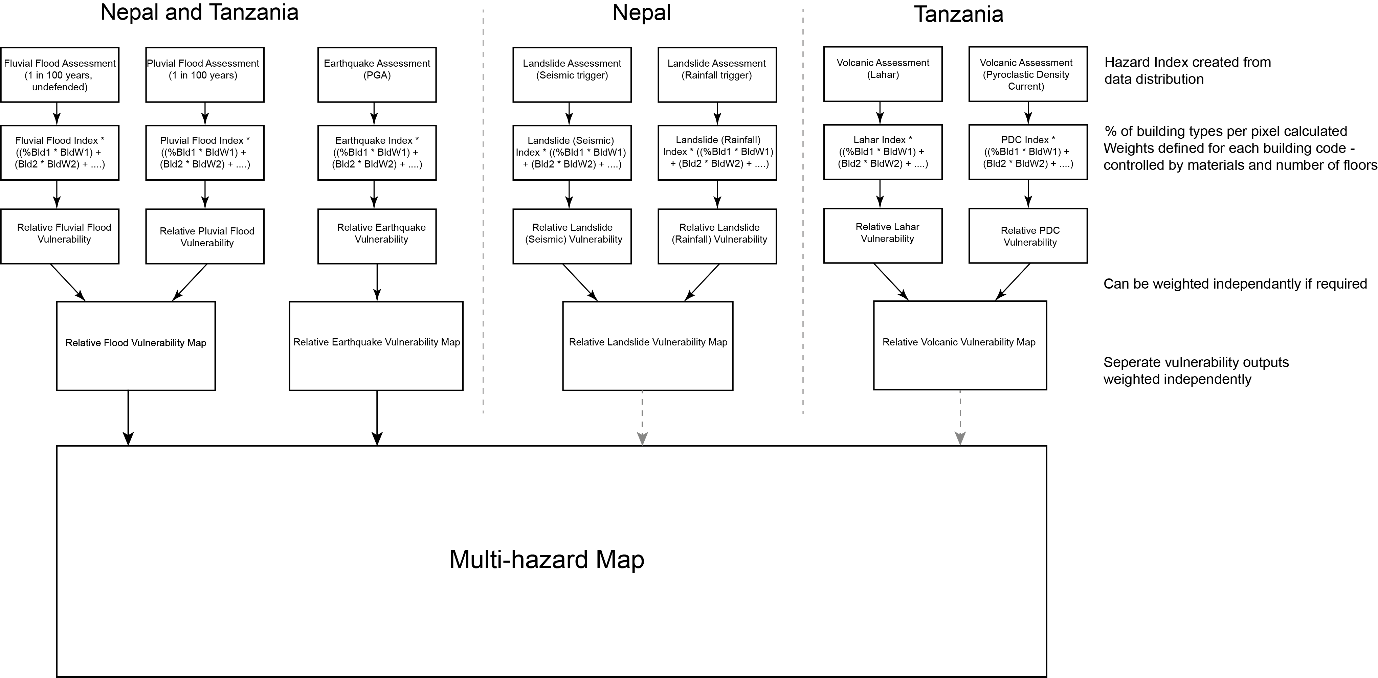
The original TOMRAP model was tested with both Tanzania data, and then later Nepal data. This section explains the generation of hazard maps in overview form. I.e. a rough explanation of what the code in hazardmap.py is doing to generate the outputs.
These steps were copied from the original Word document that accompanied the project.
Identification of the inundation zone and inundation depth zones: Using the hazard footprints generated by BGS, GEM, FATHOM etc. Data is not comparable, so must generate an index to allow for later combination of data.
Identification of factors that affect the vulnerability of buildings and people and collection of data: In this case we have selected the criteria we can easily evaluate from the exposure data generated by ImageCat – building material and building height.
Calculation of the vulnerability of individual buildings within the inundation zone: Generated weights for each building types to express the potential vulnerability of individual buildings to a specific hazard. Earthquake – determined in agreement with GEM, Flooding – based on values from Kappes and discussed with FATHOM and ImageCat, Volcanic ash and pyroclastic flows – based on vulnerability curves from GEM and published literature (Neri et al., 2000; Simkin et al., 2001; Spence et al., 2007; Auker et al., 2013 and Blong et al., 2017) and Volcanic lahars – based on values from Kappes for debris flows.
Combine single hazard ‘relative vulnerability map’ to generate a multi-hazard vulnerability map – weighted to reflect hazard frequency.
Model details
The next sections go into a little more detail. The formatting is a little unrefined but it should give you the key points of each step if these are needed in a textual form rather than trying to work it out from the code in hazardmaps.py alone. (Although hazardmaps.py is the definitive version so remember to update the below if significant changes are made.)
Step 1
Create an index value of hazard data per pixel. Ideally on a 1 – 5 scale, where the thresholds are defined by the distribution of the data (flood and earthquake).
Volcanic basins will need to be classified instead (high / medium / low), but will need to be on a comparable scale:
Volcanic Basins – convert shapes to high / medium / low hazard
Pyroclastic flow – Basin; If the pixel falls within a pyroclastic basin then assign High (5) to pixels within 0 – 15km of the summit, Medium (3) 15km – 30km. If pixel does not fall within the pyroclastic basin but does fall within 50km of the summit, assign Low (1).
Lahar flow – Basin; If the pixel falls within a lahar basin then assign High (5) to pixels within 0 – 50 km of the summit, Medium (3) 50km – 100km. If pixel does not fall within the lahar basin but does fall within 200km of the summit, assign Low (1).
(Would it be possible to have an output here that generated the hazard index maps?)
Step 2
For all exposure data calculate % of each building type per pixel.
Step 3
Use the building categories assign the following vulnerability weights – these need to be easily editable.
Building Type Weights Tables
For the original building weights tables, for buildings in Tanzania and Nepal, refer to the Multihazard_model.doc file in the docs folder.
Weighting equations and calculations
TANZANIA
Hazard Footprint Weight (HFW)
Fluvial: 0.5
Pluvial: 0.5
Earthquake – NA
Lahar: 0.45
Pf: 0.55
Apply these equations per pixel to the relevant hazard maps produced in previous sections:
Flooding
Fluvial: (HFW:0.5)*([HAZARD INDEX SCORE] * ((%CR/LFM/HBET:1,3 * 0.32) + (%CR/LFM/HBET:4,7 *0.2) + (%CR/LFM/HBET:8,20 * 0.12) + (%CR/LFINF+DNO/HBET:1,3 * 0.4) + (%CR/LFINF+DNO/HBET:4,7 * 0.25) + (%CR/LFINF+DNO/HBET:8,20 * 0.15) + (%S*0.09) + (%MUR+CB99/HBET:1,3 * 0.4) + (%MUR+CB99/HBET:4,7 * 0.25) + (%W*0.8) + (%MATO/LN * 0.56) + (%MUR+ADO/HBET:1,3 *0.56) + (%MUR+CL99*0.56) + (%MUR+STRUB * 0.56) + (%W+WWD * 0.56))
Pluvial: (HFW:0.5)*( [HAZARD INDEX SCORE] *((%CR/LFM/HBET:1,3 * 0.32) + (%CR/LFM/HBET:4,7 *0.2) + (%CR/LFM/HBET:8,20 * 0.12) + (%CR/LFINF+DNO/HBET:1,3 * 0.4) + (%CR/LFINF+DNO/HBET:4,7 * 0.25) + (%CR/LFINF+DNO/HBET:8,20 * 0.15) + (%S*0.09) + (%MUR+CB99/HBET:1,3 * 0.4) + (%MUR+CB99/HBET:4,7 * 0.25) + (%W*0.8) + (%MATO/LN * 0.56) + (%MUR+ADO/HBET:1,3 *0.56) + (%MUR+CL99*0.56) + (%MUR+STRUB * 0.56) + (%W+WWD * 0.56))
= Relative flooding vulnerability map
Earthquake
Earthquake: [HAZARD INDEX SCORE]* ((%CR/LFM/HBET:1,3 * 0.12) + (%CR/LFM/HBET:4,7 *0.32) + (%CR/LFM/HBET:8,20 * 0.16) + (%CR/LFINF+DNO/HBET:1,3 * 0.18) + (%CR/LFINF+DNO/HBET:4,7 * 0.48) + (%CR/LFINF+DNO/HBET:8,20 * 0.24) + (%S*0.2) + (%MUR+CB99/HBET:1,3 * 0.09) + (%MUR+CB99/HBET:4,7 * 0.24) + (%W*0.09) + (%MATO/LN * 0.3) + (%MUR+ADO/HBET:1,3 *0.3) + (%MUR+CL99*0.3) + (%MUR+STRUB * 0.3) + (%W+WWD * 0.3))
= Relative earthquake vulnerability map
Volcanic
Lahar: (HFW:0.45)*( [HAZARD INDEX SCORE]*((%CR/LFM/HBET:1,3 * 0.06) + (%CR/LFM/HBET:4,7 *0.1) + (%CR/LFM/HBET:8,20 * 0.06) + (%CR/LFINF+DNO/HBET:1,3 * 0.6) + (%CR/LFINF+DNO/HBET:4,7 * 0.3) + (%CR/LFINF+DNO/HBET:8,20 * 0.18) + (%S*0.3) + (%MUR+CB99/HBET:1,3 * 0.4) + (%MUR+CB99/HBET:4,7 * 0.2) + (%W*1) + (%MATO/LN * 1) + (%MUR+ADO/HBET:1,3 *1) + (%MUR+CL99*1) + (%MUR+STRUB * 1) + (%W+WWD * 1))
Pf: HFW(0.55)*( [HAZARD INDEX SCORE]* ((%CR/LFM/HBET:1,3 * 0.56) + (%CR/LFM/HBET:4,7 *0.63) + (%CR/LFM/HBET:8,20 * 0.7) + (%CR/LFINF+DNO/HBET:1,3 * 0.64) + (%CR/LFINF+DNO/HBET:4,7 * 0.72) + (%CR/LFINF+DNO/HBET:8,20 * 0.8) + (%S*0.9) + (%MUR+CB99/HBET:1,3 * 0.72) + (%MUR+CB99/HBET:4,7 * 0.81) + (%W*0.08) + (%MATO/LN * 0.8) + (%MUR+ADO/HBET:1,3 *0.8) + (%MUR+CL99*0.8) + (%MUR+STRUB * 0.8) + (%W+WWD * 0.8))
= Relative volcanic vulnerability map
Weight vulnerability map outputs
Vulnerability Map Weights (VMW)
Flood: 0.5
Eq: 0.35
Volcanic: 0.15
(Relative Flood vulnerability (please use 1 in 100 for now) * (VMW:0.5)) + (Relative Earthquake Vulnerability * (VMW:0.35)) + (Relative Volcanic Vulnerability * (VMW:0.15))
= Tanzania Multihazard vulnerability.
NEPAL*
Hazard Footprint Weight (HFW)
Fluvial: 0.5
Pluvial: 0.5
Earthquake – NA
Landslide - Rain: 0.5
Landslide - Eq: 0.5
Apply these equations to the relevant hazard maps produced in previous sections:
Flooding
Fluvial: (HFW:0.5)*([HAZARD INDEX SCORE] * ((%CR/LFM/HBET:1,3 * 0.32) + (%CR/LFM/HBET:4,7 *0.2) + (%CR/LFM/HBET:8,20 * 0.12) + (%CR/LFINF+DNO/HBET:1,3 * 0.4) + (%CR/LFINF+DNO/HBET:4,7 * 0.25) + (%CR/LFINF+DNO/HBET:8,20 * 0.15) + (%S*0.09) + (%MUR+CB99/HBET:1,3 * 0.4) + (%MUR+CB99/HBET:4,7 * 0.25) + (%W*0.8) + (%MATO/LN * 0.56) + (%MUR+ADO/HBET:1,3 *0.56) + (%MUR+CL99*0.56) + (%MUR+STRUB * 0.56) + (%W+WWD * 0.56))
Pluvial: (HFW:0.5)*([HAZARD INDEX SCORE] * ((%CR/LFM/HBET:1,3 * 0.32) + (%CR/LFM/HBET:4,7 *0.2) + (%CR/LFM/HBET:8,20 * 0.12) + (%CR/LFINF+DNO/HBET:1,3 * 0.4) + (%CR/LFINF+DNO/HBET:4,7 * 0.25) + (%CR/LFINF+DNO/HBET:8,20 * 0.15) + (%S*0.09) + (%MUR+CB99/HBET:1,3 * 0.4) + (%MUR+CB99/HBET:4,7 * 0.25) + (%W*0.8) + (%MATO/LN * 0.56) + (%MUR+ADO/HBET:1,3 *0.56) + (%MUR+CL99*0.56) + (%MUR+STRUB * 0.56) + (%W+WWD * 0.56)))
= Relative flooding vulnerability map
Earthquake
Earthquake: [HAZARD INDEX SCORE]* ((%CR/LFM/HBET:1,3 * 0.12) + (%CR/LFM/HBET:4,7 *0.32) + (%CR/LFM/HBET:8,20 * 0.16) + (%CR/LFINF+DNO/HBET:1,3 * 0.18) + (%CR/LFINF+DNO/HBET:4,7 * 0.48) + (%CR/LFINF+DNO/HBET:8,20 * 0.24) + (%S*0.2) + (%MUR+CB99/HBET:1,3 * 0.09) + (%MUR+CB99/HBET:4,7 * 0.24) + (%W*0.09) + (%MATO/LN * 0.3) + (%MUR+ADO/HBET:1,3 *0.3) + (%MUR+CL99*0.3) + (%MUR+STRUB * 0.3) + (%W+WWD * 0.3))
= Relative earthquake vulnerability map
Landslide
Landslide - Rainfall: (HFW:0.5)*([HAZARD INDEX SCORE] * ((%CR/LFM/HBET:1,3 * 0.2) + (%CR/LFM/HBET:4,7 *0.1) + (%CR/LFM/HBET:8,20 * 0.06) + (%CR/LFINF+DNO/HBET:1,3 * 0.6) + (%CR/LFINF+DNO/HBET:4,7 * 0.3) + (%CR/LFINF+DNO/HBET:8,20 * 0.18) + (%S*0.3) + (%MUR+CB99/HBET:1,3 * 0.4) + (%MUR+CB99/HBET:4,7 * 0.2) + (%W*0.3) + (%MATO/LN * 0.6) + (%MUR+ADO/HBET:1,3 *0.6) + (%MUR+CL99*0.6) + (%MUR+STRUB * 0.6) + (%W+WWD * 0.6)))
Landslide - Eq: (HFW:0.5)*([HAZARD INDEX SCORE] * ((%CR/LFM/HBET:1,3 * 0.3) + (%CR/LFM/HBET:4,7 *0.15) + (%CR/LFM/HBET:8,20 * 0.09) + (%CR/LFINF+DNO/HBET:1,3 * 0.7) + (%CR/LFINF+DNO/HBET:4,7 * 0.35) + (%CR/LFINF+DNO/HBET:8,20 * 0.21) + (%S*0.3) + (%MUR+CB99/HBET:1,3 * 0.5) + (%MUR+CB99/HBET:4,7 * 0.25) + (%W*0.3) + (%MATO/LN * 0.7) + (%MUR+ADO/HBET:1,3 *0.7) + (%MUR+CL99*0.7) + (%MUR+STRUB * 0.7) + (%W+WWD * 0.7)))
= Relative landslide vulnerability map
Weight vulnerability map outputs
Vulnerability Map Weights (VMW)
Flood: 0.333
Eq: 0.333
Landslide: 0.333
(Relative Flood vulnerability (please use 1 in 100 for now) * (VMW:0.333)) + (Relative Earthquake Vulnerability * (VMW:0.3333)) + (Relative Landslide Vulnerability * (VMW:0.333))
= Nepal Multihazard vulnerability.
Defining weights by vulnerability curve
This can now be done by supplying a separate vulnerability curve in the form of a csv file. The csv file should be formatted with the first column being the vulnerability multiplier, and the subsequent columns along being the building type (header) and the mapped intensity values below. In effect, this works as a lookup table, where the user specifies a hazard intensity (in the config file) and then this value is used to look-up the corresponding vulnerability multiplier, per building type. The resulting lookup feature then gives a specific set of weights for a given hazard intensity, which are combined into the pixel-by-pixel hazard map (as in step 3 above [multihazard_model.docx]).
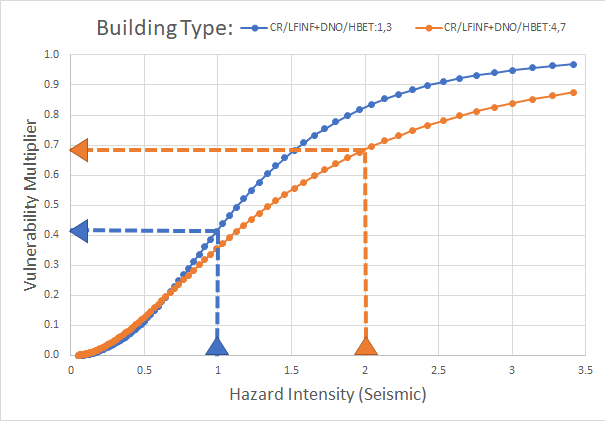
Fig. User edits Hazard Intensity in the config file, then multipliers/weights are returned by the program for each building type (2 illustrated here).
Currently this has only been implemented with the earthquake data, as we had vulnerability curves for the building types for these data (For both Tanzania and Nepal). It would be possible to extend this further to other data types, if other vulnerability curves are available in CSV format for testing.
Future items to implement
Monte carlo to look at the sensitivity to all weights
Single hazard index map
Exposure maps per building type – either number or % per pixel
Multihazard risk map
Extract multihazard risk per building type
After this I would like to experiment with having the weights be defined by an exceedance probability curve, so they would be different for every pixel. We could probably only do this for flood and seismic and would need to somehow ‘look up’ the value from a collection of vulnerability curves I have as .csv files – possibly for a smaller area to start, but ideally at national scale eventually. This would mean that the code would need to be able to read the original hazard values and the index values when adding the weighted value, as the weight would be defined by the original value but formulae would need the index value. It might be as well to try this initially with the earthquake (or PGA values), as I already have a collection of curves for the relevant building types for this hazard. It would be interesting to know if there would be a possibility to build in some functionality whereby users could either set expert elicitation weightings or upload the vulnerability curves that they have. I suppose that this would also mean that the users would need to be able to control the number of building types in their model run to match the number of building types that they have.