Web based 3D geological model viewer
BGS’s 3D geological model viewer provides on-demand generation of images of synthetic borehole log, vertical section and horizontal slices as outputs from selected 3D geological models. These are made available through a web service which is accessed via our GeoIndex user interface.
Background
Since modern computer systems allowed it, BGS geologists have captured their understanding of the subsurface in digital 3D representations. Desktop software packages allow experts full interaction with the 3D model, but until recently they were difficult to share to non-expert users within a web browser. BGS developed an early solution to this - the 3D geological model viewer - as a companion to development of the BGS Groundhog model building software.
The 3D model viewer software was released in 2012, and originally branded “Groundhog Web”. It was used within the recently retired BGS Geology of Britain viewer to display small demonstrator and public-interest models of classic geology areas such as Isle of Wight and Ingleborough. In 2014 a pay-per-view version was released to provide access to the high resolution London and Thames Valley model amongst others.
In 2021 the decision was taken to remove the paywall and provide free access to the models for London, Glasgow and Cardiff - the largest cities in England, Scotland and Wales and the latter also being sites related to our UKGEOS geothermal energy research. The models are now accessed from a new “Urban Interactive Models” data layer in our comprehensive spatial data viewer, GeoIndex.
Model development
The geological models were originally developed in GSI3D and currently in BGS Groundhog desktop software, and exported from there as a series of 2D regular ASCII grids representing the base of each rock layer. A grid representing the ground surface - the Digital Terrain Model (DTM) - is also required.
Model data preparation
From each exported ASCII grid and DTM, an in-house java executable generates an optimized binary grid format (.bgrid).
The format is a simple binary representation of an ASCII grid string; a 24 byte header that sets out the grid origin and x,y (horizontal location) cell spacings, followed by a list of the z values representing the elevation of the base of the rock layer. The z values in metres in the ASCII grid are multiplied by 10 and rounded to an integer, thus are stored as 2 byte short values as integer decimetres rather than floating point metres. This means we can retain +/- 0.1 metre precision but halving file size and speeding up grid data extraction.
Fault lineations to be drawn on the images are supplied as triangle mesh files in a bespoke xml format. The use of triangle mesh enables a more precise representation of the fault plane than the regular grid of the model layer allows, so on close inspection on the images the fault line may not exactly match the layer boundaries. Currently we are only using fault plane data for near-vertical faults on the high resolution London and Thames Valley model.
<?xml version="1.0" encoding="UTF-8" standalone="no"?>
<GeologicalObjects>
<triangle_mesh name="f1">
<vertices>
<mesh_vertex x="520003.07" y="164828.00" z="-659.09"/>
<mesh_vertex x="520003.12" y="164827.94" z="-772.73"/>
<mesh_vertex x="520003.14" y="164827.92" z="-545.45"/>
<triangle v1="625" v2="638" v3="640"/>
</triangles>
</triangle_mesh>
</GeologicalObjects>
Model metadata
The geologists compile the metadata for each model:
- model name
- description etc
and for each of the geological layers:
- name
- litho- or chrono-stratigraphic code attributed to that layer
- drawing colour
- stratigraphic sort order
- binary grid file name
The colours used for each layer are the standard colours used in BGS digital geological mapping e.g. BGS Geology 50k colours.
The metadata is provided in an excel spreadsheet, validated and then stored in a relational database.
Front end user interface
Requests to the web service are assembled using widgets in the BGS GeoIndex viewer where a certain amount of validation of requests is performed, and restrictions on the length of sections and size of horizontal slices in order to limit back-end processing load.
Back-end image generation
The synthetic boreholes and section images are built and delivered by a Java Spring MVC application, which accesses the model and layer metadata and the binary grid files stored in an accessible file system. For sufficient response times for larger models, we found that the grid files needed to be hosted on the same server as the Java application rather than accessing across a network.
As noted above, elevation values in the binary grids are stored as decimetre integers. On extraction from the binary grid the z value must be divided by 10 to get the elevation value at that grid node in metres.
We use the Java Abstract Window Toolkit (AWT) library to draw the images. The images for boreholes and vertical sections are built up based on the layer order – the interval between the deepest layer and the DTM is drawn first and filled in with the appropriate colour, and then the next deepest layer is drawn on top etc. The horizontal slice is drawn cell by cell based on which layer grid has been intersected at each x,y point in the grid, interpolating z values linearly between original grid nodes as required to align with the requested sample size.
An algorithm was implemented to choose optimal intervals for depth or distance axes tick marks whilst also taking the pixel size of the graphics font into account.
The source code is not currently made public.
Pdf template
To support presentation quality pdf downloads, pdf templates are created for each model and image type, capturing any boiler plate information such as logos and copyright statements. Apache pdf box library is used to edit the pdf template to insert the built images.
Interactive web page
Java Server Pages (JSP) are used to deliver the images within a web page along with forms that can interactively edit certain parameters such as vertical exaggeration, slice depth and image resolution.
Web service requests
There are 3 types of model view that can be requested, and 3 types of representation, resulting in 9 root web service requests:
| Borehole | Vertical Section | Horizontal Slice | |
|---|---|---|---|
| PNG image - minimal marginalia | /drawBorehole/ |
/drawSection/ |
/drawHorizontalSlice/ |
| JSP webpage - containing png image plus marginalia, links and form controls to edit the request | /displayBorehole/ |
/displaySection/ |
/displayHorizontalSlice/ |
| PDF document - containing png image plus marginalia | /downloadBorehole/ |
/downloadSection/ |
/downloadHorizontalSlice/ |
Complete web service requests are constructed using path parameters to indicate the model identifier, the surface x,y coordinate for the borehole point or section/slice vertices, the depth for a horizontal slice, vertical exaggeration, colour opacity etc.
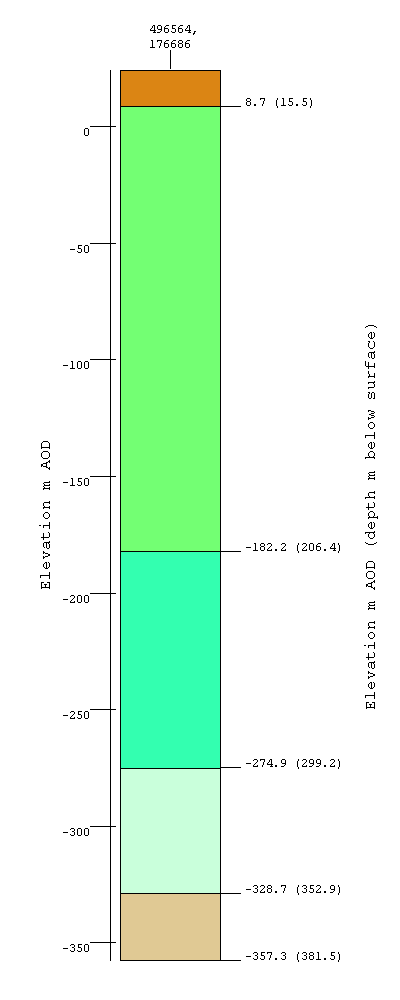
e.g. https://webservices.bgs.ac.uk/geo3dModelViewer/drawBorehole/modelId/190/x/496564/y/176686/vExag/null/
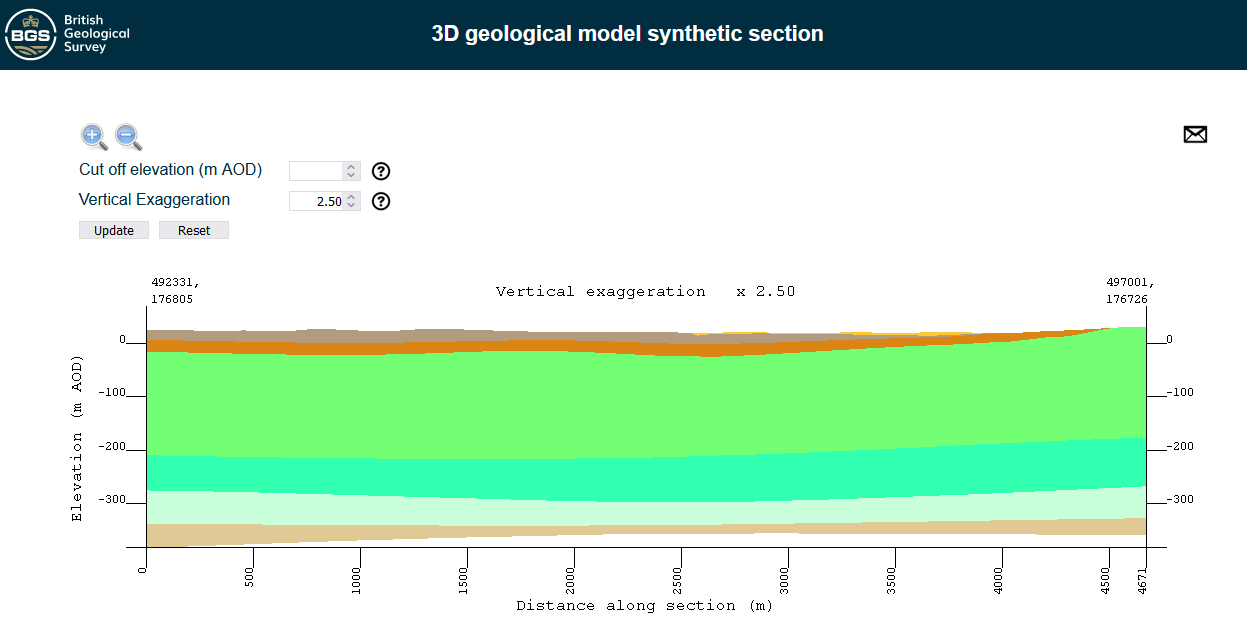
e.g. https://webservices.bgs.ac.uk/geo3dModelViewer/displaySection/modelId/190/points/492331,176805&497001,176726/vExag/null/
e.g. https://webservices.bgs.ac.uk/geo3dModelViewer/downloadSection/modelId/190/points/492331,176805&497001,176726/vExag/null/
Other endpoints are provided to help the user interface constrain the range of values e.g. to return the maximum depth of a model at a given x,y location.
Issues resolved
Grid offsets
The different modelling packages have different behaviour regarding how the exported grids are serialised i.e. whether z value represents the value at the centre of the grid cell or at one of the corners. This matters less at high resolution but can make a noticable difference on low resolution grids, producing an offset in the modelled geometry. The geologists spotted and resolved this issue.
Colour matching
In some early outputs we presented the section images alongside the snippet from the BGS digital geological map. The 2D map colours were displayed with transparency over a topographic basemap, hence lightening the tone. To match this tone in the drawn sections we initially added a transparency value, but because of the way that the graphics are built up in overlapping layers this was not successful. The problem was resolved by adding a percentage of opaque white colour to the RGB colours specified in the layer metadata.
            // transparency doesn't work with these overlapping polygons, so mimic the
            // transparency by blending with white
            Color transparencyMimicColour = addFractionOfColour(getLayerColour(intervals.get(i)), Color.WHITE, transparency);
            g2d.setPaint(transparencyMimicColour);
Depth vs elevation confusion
We had to take great care understanding and naming the variables used for depth and elevation in the user interface and web service, to make sure it was clear if the value was measured positive up (elevation) or positive down (depth), and which datum it is measured against (ground level or Ordnance Datum).
Next steps
Potential improvements
-
BGS has developed many more professional quality 3D models that could be made available through this system if it proves useful and popular. The model loading process could be automated and streamlined, but the bigger bottleneck is the time required for expert review and approval of the model as a representation of geological knowledge.
-
We would like to make available through GeoIndex the public-interest models previously available through Geology of Britain Viewer.
-
Most importantly, the application only works for layered stratigraphy with normal (extensional) faulting. We are interested in extending the tool to handle voxel grids and therefore more complex structural geology, and handle any other properties within the voxels rather than just lithostratigraphy.
Technical debt
-
The model metadata database is currently in our corporate relational database, but the data is static and lightweight so we could simplify the code by using a local JSON files instead.
-
For horizontal slice requests, the GeoIndex user interface needs to first query the web service to get the maximum model depth at the chosen location so it can constrain or validate the user’s request. This processing delay can cause the interface to report an error, and this feature is currently marked as beta status. See
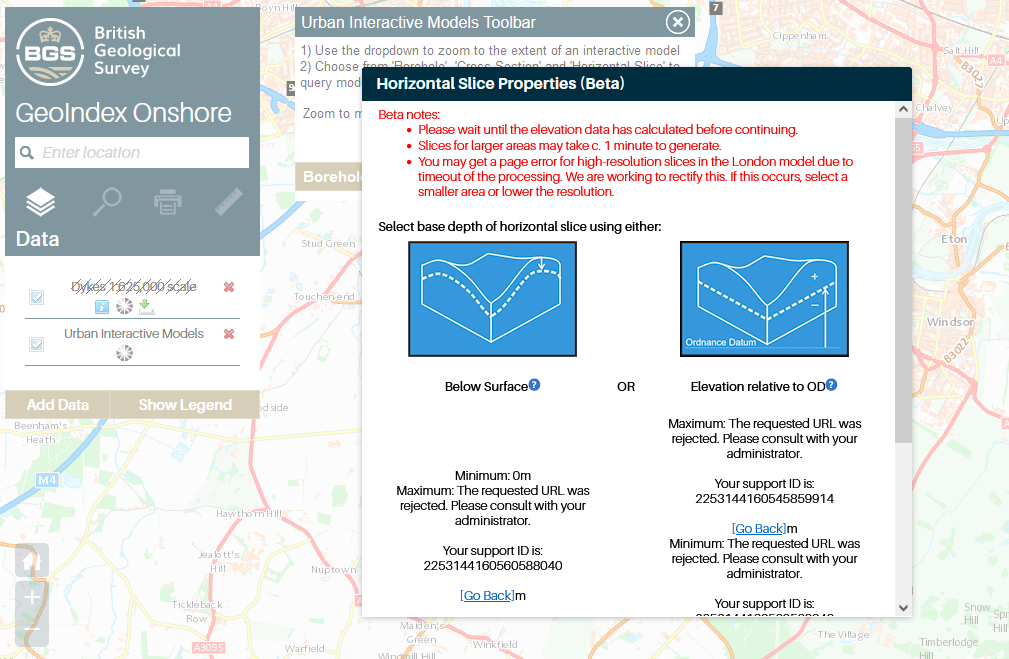
-
The web service could be re-engineered to use url query variables rather than path variables to help extensibility, and we could document the webservice using OpenAPI specification. For the time being we are not intending to serve out the raw x,y,z model data, only the built images.
comments